Title: "Your
Facility is Leaking"-Get the Picture!

General
Aerial thermal
mapping of your facility, complex, campus, military base or city every few years will reveal
leaks in all types of systems, like steam and condensate return lines, hot
water lines, chilled water lines, supply water mains, distribution pipes, storm
water drains, building heat loss and moisture leaks into your roofs. Aerial
photographs should be taken every few years as well. They are inexpensive and
can be a great asset when discussing future building additions with management,
planning utility repairs and improvements, drawing CADs of the facilities and
for uses as simple and handy as 'showing' outside contractors where not to park.
The
methodology for taking infrared (IR) thermographs is similar in many ways to
taking aerial photographs. To collect the data, the aircraft flies over a given
area with a camera mounted to the airframe and oriented looking straight-down
(NADIR) to the ground. Oblique or lower angle shots are taken out the side of
the aircraft by pointing the camera at the desired angle. The imagery is stored
on film or a computer hard drive and later copied it to a convenient
deliverable, such as a DVD. Obviously, aerial photos are taken during the day
because the sun provides brilliant visible light so one can see features on the
ground, like buildings, bridges, roads, etc.
Where
aerial infrared thermography differs from aerial visible photography is the
time of day when the survey occurs and the wavelength of the imagery that the
detector collects. IR thermography of ground objects is performed at night
because the sun and its effects on objects is a tremendous distraction in the
imagery. Thermography reveals sources of heat and the relative differences in
heat from one object to another. Infrared imagery is a grayscale picture whose
scales (or shades of gray) represent the differences in temperature and emissivity
of objects in the image. Objects in the image that are lighter in color are warmer
and darker objects are cooler. No object in an IR image is detected via visible
light wavelengths (400-700 nanometers) rather, only from thermal infrared
wavelengths in the 3000-5000 nanometers or 8000-14000 nanometers range. Lights
and other relatively hot objects are very evident, but as a result of their
heat emissions, not their light emissions. Collected IR imagery may then be
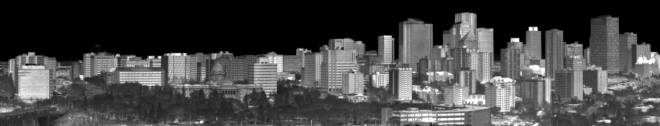
modified in a number of ways to enhance its value to the end user, such as digitally
adjusting the imagery to find particular anomalies and zooming in on different
areas of interest (see figure 1). These post-processed images can then be used
to prepare predictive maintenance reports on the various systems.
Thermal Mapping and
Ortho-Rectification
Using an
aerial high-resolution imager, surveying a couple of buildings or a mile or so
of underground lines can be done by flying over and locating the target(s) in
the imagery, saving the data and putting it together into a report. Scale
information can be gathered by taking off the existing CAD drawings or having
someone walk over the area with a tape measure. This works fine for small
areas, but it is not possible to make precise thermal maps of a whole complex,
campus, military base or city without ortho-rectification of the imagery.
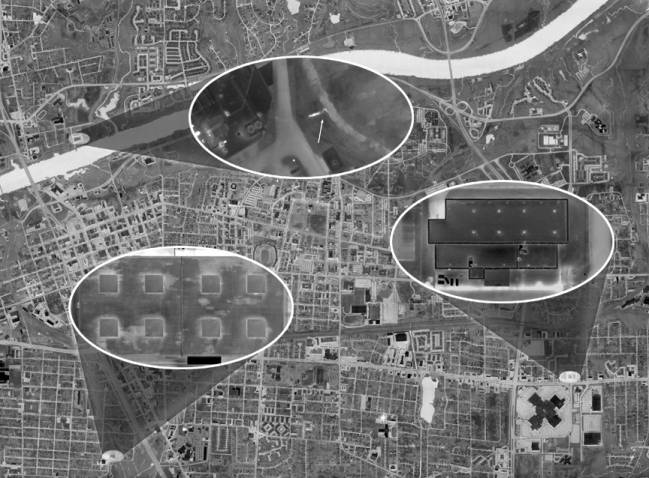
Figure 1)
Ortho-rectified, geo-TIFF mosaic thermal image of a small city.
In order to
produce ortho-rectified thermal maps, the ultimate [most useful] product, much
more information must be gathered and tagged to the IR imagery. During the flight,
the aircraft flies straight, smooth lines on a pre-planned grid, allowing 25%
side lap of the imagery. The IR operator manages the sensor data-acquisition
(see figures 2, 3) following a structured checklist for orderly data file
management. The imagery must be collected with a precise direct-digital timing
system, a 3-axis ring-laser-gyro and an inertial navigation system (INS), which
is tightly-coupled to a real-time differential GPS satellite positioning system
that provides x, y, z positioning of the aircraft at all times. After imagery is
collected and QC is verified, the digital infrared imagery is then processed
into a series of ortho-rectified image tiles, which are stitched together to
create a giant mosaic image. An on-board computer system puts all this
information together using a digital elevation model (DEM) of the scene that
consists of a uniform grid of point elevation values and the position and
orientation of the camera with respect to a three-dimensional coordinate
system. The result is presented as a high-resolution IR image in the form of a geo-TIFF,
which is compatible with any GIS software such as ESRI ArcView, AutoCAD 3-D
Map, Global Mapper, MapInfo, etc.
Applications for Thermal Mapping
Once high
quality digital thermal and photographic ortho-rectified maps are created,
these can be added as layers to existing CAD and GIS systems and to other data
sets. By post-processing the imagery, many wasteful conditions can be found and
reported. The maps and reports help facility managers keep up with their assets
in a very efficient manner. Below, some of the low-hanging fruit of back-end
post-processing of the information is discussed.
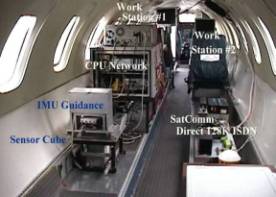

Figures 2, 3) Aircraft
and installed data acquisition systems.
Steam and
condensate return lines (see figure 4) are almost always readily visible with infrared imaging,
even when no notable problems exist. This is due to the fact that no matter how
good the insulation, there is always heat loss from the lines which makes its
way to the surface. Problem areas are generally quite evident, having brighter
infrared signatures that exceed the norm. Steam line faults normally appear as
an overheated line or as a large hotspot in the form of a bulge or balloon along
the line. Overheated lines often occur when the steam line is located in a
conduit or tunnel. If there is a leak in the line, it will heat up the conduit
with escaping steam. If a steam line is buried directly in the ground with an
insulating jacket, a leak will usually saturate the insulation, rendering it
largely ineffective and begin to transfer heat into the ground around the leak,
producing the classic bulge or balloon-like hot area straddling the line. Some
leaks may show up as an overheated manhole or vault cover. Manholes or vaults
that contain leaking steam system control apparatus will often heat the covers
to warmer than normal temperatures.

Figure 4) IR
thermograph showing a leaking steam line (highlighted in red).
A leaking sewer line or water main (see figure 5) may go undetected for
years, especially if the leaking liquid is flowing into a storm drain or a
stream that no one monitors. Leaking sewage collector lines, storm water drain
discharges, water mains and taps into storm water drainage lines can often be
identified by their thermal infrared signatures during cold times of the year.
As these sources of waste or pollution leak, seep or empty into creeks,
streams, rivers and lakes, their thermal signatures vary from their
surroundings because the liquid from under the ground is relatively warm
flowing across the ground and down a bank into a stream and because the warm
plume of liquid joining and flowing downstream with the body of water are detectable
due to the difference in temperatures of the two liquids. Late fall, winter and
early spring are well suited to this type of inspection because of the cooler
water temperatures (ground and surface waters) and because the interference to
view by foliage is minimized. Ground water seeps and outfalls of all types are
also easily distinguishable for similar reasons.

Figure 5) Thermograph
of a storm drain (highlighted in red) leaking wastewater down to the bank and
joining the flow of a creek. The leak is coming from the adjacent building.
Roof moisture survey reports (see figure 6) are made by
capturing IR and visual images and making scaled drawings of the wet areas, so
that surgical repairs can be accomplished. Almost all roof insulation materials
discarded in the US annually are dry. Why throw away 95% of the insulation when
it is not damaged? With a thermal map of a group of buildings one can narrow
down the roofs that have problems from the ones that do not…on a wholesale
basis. This allows facilities management to concentrate on those roofs that
need to be repaired, while keeping a trend-quality image of the good roofs.
Subsurface
wet areas in a flat or low-sloped roof show up as lighter areas in the IR
imagery at night because the latent heat (from daytime heating) in the trapped
water mass is greater than in the dry, functioning insulation or roof
substrate. Areas of roof moisture contamination can be nebulous in shape and
sometimes mottled in appearance, although they are commonly found in linear or
puddle-like shapes. The linear shapes many times follow low areas, drainage
routes, roof edges and seams. Puddle-like round or oblong shapes often form
around roof penetrations such as mechanical equipment, standpipes, vents and drains.
After sunset when the entire roof structure cools down, wet areas of roof
insulation and other materials continue to radiate heat because of their higher
mass.
Figure 6, 7, 8)
Photograph, thermograph and CAD drawing of a flat roof with moisture contamination.
Advantages of Aerial IR Imaging of Roofs
•
High-angle,
straight-down infrared images capture large areas at once, making the imagery
easier to analyze and the report clear and concise. Because infrared images,
visual images and AutoCAD® drawings are reconciled, it is less expensive to
produce detailed reports.
•
Plan
view imaging allows for accurate marking of areas of suspect roof moisture
contamination. AutoCAD® drawings are made by drawing ‘over’ the captured visual
and infrared image on the screen.
•
Logistical,
image quality, access and security problems, which are common when performing
on-roof IR surveys, are eliminated. The printed AutoCAD® drawings can be used
on the roof to paint areas of moisture contamination directly on the roof, if
desired. There is never a time when on-roof IR produces better results than
aerial IR.
With the
roofs surveyed and existing CAD drawings corrected, updated, saved and layered
into a GIS or CAD system, the facilities operator takes control of all the roofs.
Knowing the condition of all the roofs allows for better life-cycle preventive
maintenance, warranty enforcement, budget planning and improved roof asset
management.
Conclusions:
The farther
one can get from the subject of any imaging survey, while maintaining the
resolution to achieve the needed image quality, the more useful the data
becomes. This is the aerial advantage. But, one needs to obtain very high
resolution imagery in order to survey large areas.
It is true
that a picture is worth a thousand words; so get the big picture of your
facilities and start speaking volumes about its condition.
CALL 800-248-7226.